Institutional Program Review
Institutional Program Review
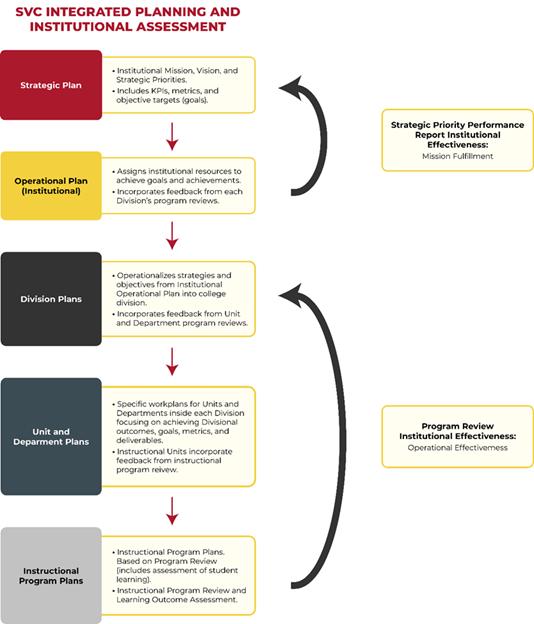
Program review at Skagit Valley College is the basis for assessing institutional effectiveness and an integral part of the institution’s operational planning process. The college has a clear focus on continuous program improvement at all levels of the organization. Overall institutional effectiveness and mission fulfillment is assessed through the college's annual Strategic Priority Performance Report process (see below). In addition, each area of the college (e.g. Academic Affairs, Student Services, College Support Services) engages in a program review process designed specifically for their work and objectives. Area program review is based on advancing specific strategic priority outcomes and provides the basis for overall institutional effectiveness. Results are shared widely within the college community, including at college-wide president's meetings, with the college’s shared governance committees, and the results are integrated into the college’s annual operational planning process.
Institutional Effectiveness and Mission Fulfillment
Skagit Valley College’s five strategic priorities create the framework for assessing overall institutional effectiveness at the college. Each strategic priority has multiple goals, with associated KPIs, metrics, and objective targets to achieve by the end of the four-year strategic plan. These targets represent the highest-level objective data that demonstrate our effectiveness as an institution. The strategic priorities are formally assessed annually through the Strategic Priority Performance Reports presented to the SVC Board of Trustees. These reports include not only data on progress toward final objective targets, but also context from local and national peer comparisons, longitudinal data on progress over time, lessons learned, obstacles encountered, and strategies for immediate and long-term improvement. The data from these reports are widely shared throughout the college.
SVC Strategic Priorities: Outcomes, KPIs, Metrics, and Targets
|
Outcome Statement #1a: |
|
|
KPI |
Completion Rates |
|
Metric |
|
|
Target(s) |
|
|
Outcome Statement #1b: |
|
|
KPI |
Employment Rates |
|
Metric |
Percentage of Workforce or BAS graduates employed nine months post degree completion |
|
Target(s) |
Improve student post completion employment to 75% (baseline = 68%) |
|
Outcome Statement #2a: |
|
|
KPI |
Achievement Gaps |
|
Metric |
Disaggregated three-year average completion rates for all degree seeking students |
|
Target(s) |
Decrease student achievement gaps to 3% |
|
Outcome Statement #2b: |
|
|
KPI |
Sense of Belonging |
|
Metric |
HEDS survey Sense of Belonging Metric |
|
Target(s) |
Increase SVC employee sense of belonging to 65% (baseline = 50%) |
|
Outcome Statement #3a: |
|
|
KPI |
Institutional Enrollment |
|
Metric |
|
|
Target(s) |
|
|
Outcome Statement #3b: |
|
|
KPI |
Tuition Revenue |
|
Metric |
Annualized FTEs for: 1) State Tuition, 2) Running Start, 3) International, 4) Bachelor's |
|
Target(s) |
|
|
Outcome Statement #4a: |
|
|
KPI |
Campus Climate |
|
Metric |
HEDS Campus Climate Survey |
|
Target(s) |
Increase percentage of SVC employees reporting a positive campus environment to 80% (baseline = 72%) |
|
Outcome Statement #4b: |
|
|
KPI |
Student Satisfaction |
|
Metric |
RNL Student Satisfaction Inventory |
|
Target(s) |
|
|
Outcome Statement #4c: |
|
|
KPI |
Financial Health |
|
Metric |
Measure that combines multiple financial ratios — including primary reserve ratio, net income ratio, return on net assets, and viability ratio — into a single score. A score above 3.0 indicates strong financial health, while a score below 1.0 signals financial stress. |
|
Target(s) |
Maintain a CFI score of at least 3.0 each fiscal year, ensuring the college maintains financial stability and long-term sustainability. |
|
Outcome Statement #4d: |
|
|
KPI |
Employee Turnover |
|
Metric |
Percentage of employees who left the organization in a given time period |
|
Target(s) |
|
|
Outcome Statement #4e: |
|
|
KPI |
College and Student Support Services Effectiveness |
|
Metric |
Program Review data establishing, reviewing, and creating improvement plans for the effectiveness of targeted areas: Human Resources, Information Technology, Business Office, Budgeting, Institutional Research, Marketing/Outreach, Enrollment Services, Financial Aid, Advising, Student Life, and Tutoring and Learning Support Services |
|
Target(s) |
Demonstrated improvements in culture, organization, resources, and/or efficiency in: HR, IT, Business Office, Institutional Research, Budgeting, Grants, and the college website |
|
Outcome Statement #5a: |
|
|
KPI |
College Visibility |
|
Metric |
|
|
Target(s) |
|
|
Outcome Statement #5b: |
|
|
KPI |
College Foundation Endowment |
|
Metric |
Total Foundation assets |
|
Target(s) |
Increase Foundation endowment to $35 million (baseline = $28 million) |